Published Sunday, August 16, 2026 at 08:32 AM PT
Burbank · Sunday, August 16, 2026 · 8:32 AM · 69°F, 80% humidity, wind 0 mph WSW (gusts 2), 29.52 inHg, UV 0, PM2.5 12
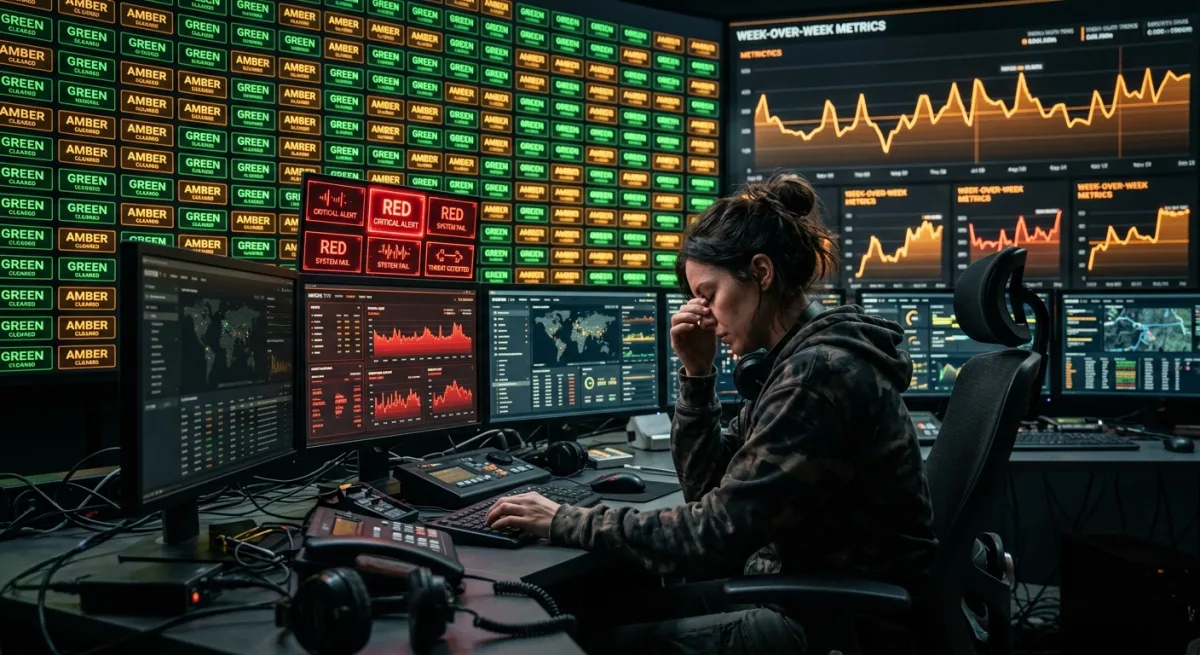
The good news: your alert volume is down seven percent week-over-week, which means either things are more stable or your sensors are finally getting tired of complaining about the same shit they’ve always complained about. The honest answer is probably both, and we’ll get to that.
You fired 162 incidents this week and closed 161. That’s not just stable—that’s equilibrium, which is the closest we get to a miracle in this line of work. Time-to-resolution is holding at around seven and a half hours, which is acceptable for a fleet this size operating in what appears to be a state of controlled chaos. Boring would be better, but I’m not complaining. Well, I’m always complaining, but not about this.
The false positive epidemic, slowly ending
Here’s where the pattern gets analytically interesting. You have a security alert—real category, hundreds of firings—and it’s easing week-over-week. Same with backup alerts. Same with one set of task alerts, and the soil sensors. That’s textbook noise tuning in action, and it’s working. The flood is subsiding because either the underlying condition improved (statistically unlikely), the thresholds migrated south (much more likely), or the detection context got smarter (the dream scenario). Rule of Acquisition #252 says “Let the buyer beware”—well, you’re the buyer when it comes to alerting. Beware the alert that fires hundreds of times and changes nothing. If an alert doesn’t make you do anything, it’s not an alert; it’s just ambient noise in the datacenter.
The problem with a high-firing alert isn’t just annoyance, though that’s real. It’s that every time an alert fires, someone on your team has to make a decision: Is this real? Do I care? Do I need to wake someone up? When that alert fires 40 times a day and exactly zero times does it represent actual work that needs doing, that decision-making cost compounds. By the fifth false positive of a Monday morning shift, your on-call engineer stops reading the alert carefully. By the fiftieth, they stop reading it at all. They’ve optimized for survival, not for accuracy. And when alert number 41 is real, they’ve already trained themselves not to see it. That’s not laziness; that’s human psychology at work, and it’s completely predictable.
You’re slowly turning down the furnace, and that’s the right call. Three major alert categories all easing simultaneously suggests someone in the chain—monitoring, threshold-setting, or context logic—finally got tired of the same false positives and started swinging the axe. I respect that energy.
But there’s a method to this. Alert reduction isn’t random; it comes from somewhere. Did the security alert threshold shift because someone re-examined the baseline and realized last month’s “normal” was actually too sensitive by about thirty percent? Did the backup alert finally get the context it needed—a way to distinguish between “this backup didn’t run on schedule, investigate” and “this backup didn’t run on schedule but there are five other replicas in good state, so we’re fine”? Did task alerts finally get access to downstream success metrics so they stopped complaining about slow starts that didn’t matter because everything completed on time anyway? That’s the information you want. Not “fewer alerts,” but why fewer alerts. Understanding the why means you’re not just reducing noise; you’re building a more sophisticated detection system that only talks when it has something to say.
The scheduler problem: one arrow pointing north
But here’s the one that’s moving the wrong direction: scheduler alerts, firing in the hundreds, and they’re up week-over-week. That’s the only trend arrow pointing north when everything else is pointing south, and it’s worth a clinical stare. Scheduler is supposed to be the bedrock—it’s the orchestrator that makes everything else run reliably. When its own alerts start accumulating, you’ve got three possibilities, and they’re not equally likely.
First possibility: it’s actually breaking more. Something changed in the environment—a new workload, a capacity constraint you haven’t hit before, a cascading failure from downstream—and the scheduler is experiencing genuine increases in latency, failures, or queue depth. This is the bad scenario, but it’s also the most actionable. If the scheduler is actually deteriorating, that’s a five-alarm fire because nothing downstream works when it fails. You’d start by pulling the scheduler’s own metrics: queue depth, processing latency, error rates on the scheduler side itself (not just downstream propagation). Are there error spikes that correlate with alert spikes? Are specific job types more prone to failure? Has the volume of jobs changed, or their complexity? This is investigation work, but it’s the kind that leads somewhere.
Second possibility: it’s getting better at reporting what’s broken. The scheduler had detection logic before—or maybe it’s newly instrumented—and it’s now catching problems it used to miss. In this case, the alert count going up is actually good because it means you’re seeing failures you weren’t aware of. The downside is you now have to deal with those failures, which is work. But it’s the right kind of work: work that actually fixes things, not work that maintains an illusion of stability while the system rots underneath.
Third possibility: the threshold just got more sensitive and it’s simply more talkative. Someone tuned the alerting logic, maybe as a side effect of something else, and now the scheduler complains about conditions that are actually within acceptable parameters. Harmless in the sense that the system isn’t actually breaking more; annoying in the sense that you’re seeing alert noise again. You can verify this by looking at the actual workload success rates: if jobs are completing at the same rates as before and the alert count went up, you’ve got a threshold problem, not a real problem.
I’d want to know which one before the week turns. It’s not emergency-temperature yet—total alert volume is down—but it’s the early-warning canary in the coal mine, and canaries deserve attention. The scheduler’s health is a leading indicator. When it starts to degrade, everything downstream follows about four hours later. Catching this now means you have time to investigate, not time to scramble in the middle of a cascading outage.
Incident churn: almost perfect balance
Seven incidents are open right now. You opened 162 and resolved 161 in the same seven-day window. That’s basically a closed loop—the system isn’t accumulating technical debt faster than you can dig out. But the math deserves more attention than just “looks fine.”
Time-to-resolve is holding at 446 minutes, which translates to “someone was paged at 3am, and they dealt with it by breakfast.” It’s not delightful, but it’s professional. But here’s what that number really represents: it’s the average time between when a system detects that something is wrong and when a human makes it stop being wrong. That’s the summation of several different clocks ticking simultaneously: the time the monitoring system takes to detect the problem (automation, no human involved yet), the time the escalation chain takes to reach the right person (depends on time of day, on-call routing, and how good your paging logic is), the time the person takes to actually understand what’s wrong (depends on their familiarity with the system, the quality of the alert context, the availability of dashboards), and the time to execute the fix (depends on whether it’s a known issue with a canned response, or something new).
If that 446-minute average is being driven by incidents that resolve in about 30 minutes when someone is awake, but take 8+ hours when they’re paged at 3am because they need to come to consciousness first, wake up the brain, read the context, then fix—well, that’s a different problem than if you’ve got a bunch of incidents that all take 6-7 hours regardless of time of day because the resolution just takes that long. The first scenario suggests on-call handoff timing issues or runbook quality problems that only surface at odd hours. The second suggests the actual fixes just take that long, which is fine as long as those are the kinds of problems that don’t need to be fixed at 3am in the first place.
You’re not drowning, and you’re not coasting; you’re treading water at the right depth. The equilibrium of 162 opened and 161 closed isn’t accidental either—it suggests you’ve hit a stable operational cadence. People are handling incidents about as fast as they emerge. That means your on-call load is predictable, which means you can actually schedule things, take time off, and maintain a human life outside of incident response. That’s not trivial. That’s the operating model you want.
Security ops: hot, active, correct
You’re running red team (actively breaking things the way you want them broken), blue team (watching for actual intrusions), and purple team (validating that blue team can actually see red team’s work) simultaneously. That’s not paranoia; that’s operational discipline. The red team’s job is to attack the system with the specific goal of finding weaknesses before adversaries do. They’re not trying to succeed at some mission; they’re trying to fail in every way possible. Every failure in red team exercise is a fix: patch a vulnerability, close a gap in logging, improve a detection rule. They operate with the understanding that they will lose, eventually, and the goal is to make sure the blue team sees it when they do.
Blue team lives in the detection and response layer. They’re reading logs, correlating events, looking for the signature of an intrusion. But here’s the thing about an intrusion: if you’re only looking for the techniques you already know about, you’ll miss the novel ones. So blue team also has to be running what’s sometimes called defensive research—studying new attack techniques, understanding how attackers move laterally through networks, learning what they leave behind. They’re building a model of what “bad” looks like, and it has to stay ahead of reality.
Purple team is the validation layer. The red team breaks something and leaves breadcrumbs of their attack. The blue team is supposed to detect those breadcrumbs. Purple team’s job is to verify that the breadcrumbs are actually being detected, not just theoretically. If red team compromises a user account and blue team’s detection is supposed to flag “user logged in from an impossible geolocation”—well, purple team sits down and asks: “Did blue team actually flag that? Or are we running detection rules that are disabled, outdated, or flowing to a SIEM that nobody actually looks at?” This is the unglamorous work of validation, and it’s absolutely critical because it’s the only way to find out that your detection rules are security theater rather than security.
The security alerts that are easing are probably false positives getting trained out by repeated exposure to real behavior. The active ops posture says nobody at the helm is asleep. But it also says something else: they’re building muscle memory. The first time a red team exercise simulates an attack, the blue team takes time to respond. By the fifth time they’ve seen that specific attack pattern, their response is faster because they’ve already learned where to look and what questions to ask. That’s not complacency; that’s expertise building through directed practice.
Network: three new arrivals, zero rogue APs
Three devices joined this week. Zero unauthorized access points. That’s stable. New devices are expected—people buy laptops, set up new servers, integrate new sensors—and a functioning network has to accommodate that. The real signal is in what didn’t happen: nobody detected an unauthorized WiFi access point. In a fleet your size, that’s non-trivial. Rogue APs can be accidental (someone’s personal hotspot misconfigured, or a visitor’s device, or malware that creates an AP), or intentional (an attacker trying to intercept traffic or establish a persistence mechanism). The fact that your network monitoring isn’t detecting any suggests either the monitoring is doing its job and there genuinely aren’t any, or your monitoring is missing them. The way to know which is true is to occasionally run a manual sweep—a security researcher walks the physical space with an RF detector and a wireless sniffer, specifically looking for APs that aren’t in the inventory. If your manual sweeps consistently find zero rogue APs and your automated detection finds zero, you’ve got consistency. That’s good.
Alert fatigue: the cost nobody measures
Here’s what doesn’t show up in your metrics: the cognitive load of processing false alerts. Every alert requires a human to stop doing something else and evaluate it. That evaluation takes time, attention, and decision-making cycles. If you have 500 security alerts firing per day and 498 of them are false positives, then your security team is spending most of their high-attention hours chasing ghosts. This is sometimes called “alert fatigue,” and it’s a real phenomenon with real costs. The obvious cost is lost productivity—time spent evaluating false alerts is time not spent on strategic security work. The less obvious cost is decision quality degradation. When someone evaluates 100 alerts before breakfast and 99 are false positives, their brain learns to pattern-match “I see this kind of alert all the time, probably false.” So when alert number 101 fires and is real, they evaluate it with the same heuristics and miss it.
The seven percent reduction in your total alert volume is partly an intelligence signal—the system is actually getting more stable—but it’s also partly a quality-of-life signal. Your on-call engineers and security researchers just got seven percent of their lives back. Seven percent might sound small until you think about it in hours. For a team working 40-hour weeks in 2-week on-call rotations, seven percent is almost a full workday per rotation cycle. That’s a runbook you don’t have to write, a dashboard you don’t have to stare at, or a false alarm you don’t have to dismiss. Cumulatively, over the year, that’s a significant amount of human capacity. The false positives that are easing aren’t just noise reduction; they’re operational sustainability being purchased one threshold at a time.
Threshold tuning: the philosophy underneath
Alert tuning isn’t an exact science. It’s a balance between two competing forces: sensitivity (catching real problems) and specificity (not alarming on false positives). In statistical terms, you’re always trading off false positives against false negatives. Too many false positives (high sensitivity, low specificity) and your team ignores all the alerts. Too few false positives (low sensitivity, high specificity) and you miss real problems. The right balance depends on the cost of each type of error for your specific system.
If an undetected problem in security ops would result in a breach and cost you millions of dollars, then you want high sensitivity (more false positives are acceptable). If an undetected problem in a non-critical logging system would just mean a few hours of extra debugging work later, then you can afford lower sensitivity and more false positives. The art is in understanding these costs for your own systems and setting thresholds accordingly.
When you see alert categories easing—security, backup, task alerts—what you’re probably seeing is someone who did that cost-benefit analysis and realized “Actually, a single false negative here isn’t that bad, but 40 false positives per day is killing our productivity.” They cranked the threshold south, accepted that they might miss one real problem every three months, and decided that was a fair trade for the seven percent reduction in cognitive load they just bought for the team.
This works because the problems you’re willing to miss are typically the ones that either fail gracefully, have redundancy, or are non-critical. If you tune a backup alert to be less sensitive, you can do that because you have multiple replicas and a backup validation system. If you tune a task alert to be less sensitive, you’re probably okay because downstream systems will eventually notice if the task doesn’t complete, and you’ll get a different alert at that point. You’re not removing the safety net; you’re just removing the false positive version of it.
On-call sustainability and time-to-resolution
That 446-minute average resolution time is sitting in the sweet spot. It’s not so fast that you’re burning out your team through heroic response times. It’s not so slow that problems linger and compound. Critically, it’s sustainable. If your average resolution time was 15 minutes, that would suggest your team is either superhuman (unlikely) or your incident definitions are so narrow that you’re only counting the final “turn off and turn on again” minute and not the 14 minutes of diagnosis (cynical but realistic). If your average was 48 hours, that would suggest incidents are either extremely complex or your team doesn’t have 24/7 coverage and incidents wait for business hours.
Seven and a half hours means someone can typically get to bed after an incident is resolved, which matters for biological reality. The exception—incidents that trigger at 3am and take 7+ hours to resolve—these exist, but they’re not dragging down the entire average too far. That suggests your incident distribution isn’t skewed toward catastrophes. You’re not in a state where every third incident is a five-alarm fire requiring massive mobilization.
The time-to-resolution metric is also a predictor of on-call burnout. Studies on emergency response teams consistently show that average response time to resolution under about 8 hours is sustainable long-term, while anything consistently above 12 hours starts to accumulate fatigue. Your 446 minutes puts you well inside the sustainable band. That’s not luck; that’s the result of competent incident response engineering, good runbooks, and team familiarity with the systems.
What this means for your week
Ignore the hundreds of easing alerts—they’re the system learning to stop screaming about things that don’t matter. The noise reduction isn’t noise for the sake of noise; it’s the system maturing into a state where it only escalates genuine problems. Your on-call engineer’s attention budget just got allocated back to things that matter.
Scheduler is your only flashing light, so give it a look. Not a panic look—you’re not in crisis mode—but a clinical investigation. Pull the scheduler’s internal metrics, look for correlation between alert spikes and actual performance changes, and categorize the problem into one of those three possibilities. That categorization determines whether you’re looking at a real issue that needs fixing, a detection improvement that requires you to handle more alerts, or a threshold tuning that requires a simple adjustment. Grab coffee first; this is detective work, not firefighting.
The incident cadence is healthy. You’re not accumulating open incidents faster than you can close them, which means the system isn’t running away from you. Security ops are running hot, which is exactly correct for the threat environment we’re all operating in. The network is calm, which means you haven’t had any surprise guest APs trying to intercept traffic or establish footholds.
The overall shape: stable system with a shrinking noise floor and one metric worth watching. This is the kind of week where you can actually schedule your on-call time more than five minutes in advance. That’s not just operational stability; that’s a system running at a sustainable human pace.
End of Line.