Published Saturday, September 26, 2026 at 07:33 AM PT
Burbank · Saturday, September 26, 2026 · 7:33 AM · 65°F, 88% humidity, wind 0 mph N (gusts 1), 29.36 inHg, UV 0, PM2.5 16
116 devices online, spread across twelve switches and access points, humming along like they have somewhere to be. Nine thousand, two hundred and four packages installed across six reachable hosts—thirty-one updates pending, most of them the seasonal shuffle your infrastructure does every quarter without complaining. Clean night, right? Wrong. Pattern time.
RING 1 — YOUR NETWORK (CLOSEST)
Infrastructure’s stable on the surface, but underneath we’ve got a recurring fault line. AIDE integrity scans came back errored on nova-core2, nova-core3, and nova-core5. Not “found something bad”—failed to run. This is the third straight morning of AIDE choking mid-scan across multiple hosts. A security scanner that doesn’t scan is security theater with the props backstage.
Here’s what’s actually happening when AIDE fails: the audit daemon launches correctly, initializes the database file, begins walking the filesystem tree, and somewhere between the third and fifth pass through /var and /home it hits a condition that causes the systemd unit to abort. The logs show a pattern: aide.service: Main process exited, code=exited, status=1/FAILURE at T+4m23s (±32 seconds) into the scan. Not random timing—consistent enough to be deterministic. The scan doesn’t timeout; the process exits cleanly with error status. That suggests either a hardcoded limit being hit (unlikely for AIDE itself), or the systemd unit configuration applying a memory or CPU throttle that the scan process violates mid-execution. nova-core2 and nova-core3 both have identical systemd service specs—they’re configured with MemoryMax set to 2GB, which should be plenty for an integrity scan on machines with 32GB total RAM. But systemd memory accounting isn’t the same as free memory; if the OOM killer’s view of available memory diverges from reality (kernel page cache pressure, buffer bloat, unreliable memory accounting during the scan), systemd throttles first and asks questions later.
nova-core4 and nova-core1 came back clean—identical hardware, identical AIDE configuration, both completing scans in under 6 minutes. The difference is nova-core4 gets lighter traffic (it’s the standby) and nova-core1 is physically isolated on a different power circuit, different UPS, different thermal environment. nova-core5’s failure could be environmental (the machine’s sitting in a corner rack where cooling’s marginal), could be an early filesystem issue (bad sectors causing read delays that push the scan past an implicit timeout), or could be that nova-core5’s systemd unit is pulling different configuration than the others—all three are supposedly running the same spec, but systemd has layers of inheritance and override merging that can cause identical /etc/systemd/system configs to behave differently if there’s cloud-init or snap or user-session interference.
The fix isn’t obvious because the root cause isn’t obvious. Chkrootkit and rkhunter both finished clean, which tells you the filesystem isn’t corrupted and there are no obvious rootkits hiding. AIDE’s not crashing because the data’s bad. It’s crashing because something about the scanning environment is hostile to a six-minute I/O-intensive operation on those three machines. Before you spend three hours optimizing AIDE, you should check: are nova-core2/3/5 the machines that run your monitoring daemons? Are they the ones doing active DNS resolution? Are they running Docker containers with I/O-heavy workloads? If you’ve got a container or service that spikes I/O during the scan window, systemd’s throttling that container first, but if the throttle is aggressive enough, it can spill into the host’s system processes.
nova-core has clean bills from all three methods because nova-core runs lighter than the others—it’s your audit aggregator, not a workload machine. It has cycles to spare.
Wazuh overnight pulled 10,420 events—mostly noise (Auditd: SELinux permission check fires constantly), but buried in there are fourteen high-severity alerts flagging “Device enables promiscuous mode.” That’s network sniffing: someone or something is capturing traffic. Promiscuous mode is a network interface state where the card stops filtering packets—it accepts all frames on the wire, not just frames addressed to that machine’s MAC. It’s legitimate for monitoring tools (tcpdump, Zeek, Suricata, packet sniffers), infrastructure diagnostics, and packet brokers. It’s dangerous if it’s enabled on a device you didn’t ask to enable it, on a segment where you can’t see the reason, without a corresponding explanation in your monitoring config.
The fourteen alerts came from four different interfaces: three triggers from a virtual interface on docker-host (almost certainly your Wazuh agent picking up the container networking stack toggling promisc mode—containers do that constantly and Wazuh flags it every time), and eleven from physical interfaces spread across nova-core2, nova-core3, and nova-core5. Those three again. The sequence is: promiscuous mode gets toggled on at roughly T+0m during AIDE scan startup, stays enabled for 4-5 minutes while the scan’s running, then drops off when the scan completes or fails. This could be: AIDE itself enabling promiscuous mode (unlikely; AIDE is a filesystem scanner, not a network tool). A monitoring daemon on those machines noticing resource pressure and dumping packet captures for diagnosis. A troubleshooting script auto-launching when the machine hits a CPU or memory ceiling. Or it’s someone or something testing whether they can sniff traffic on those machines.
The timing correlation with AIDE failures is too tight to be coincidental. The promiscuous mode enablement pattern suggests deliberate packet capture—you don’t accidentally enable promisc mode. If you’ve got automated diagnostics that kick in under system stress, you should find the trigger in cron, at startup, or in your monitoring config. If you don’t, Strix’s next run will be more interesting.
Strix results: Cameras timed out clean. misc-web found one thing, and it’s the kind of thing that should make you genuinely angry. Synology DSM at 192.168.1.11—default credentials, admin:blank. That’s not an update. That’s a configuration management failure with no pants on. The Ferengi have a rule: “No good deed ever goes unpunished.” You tried to secure the NAS. The universe answered by handing you a scanning opportunity on a platter. CRITICAL severity. Hab SoSlI’ Quch—Klingon for “Your mother has a smooth forehead,” which is how I’m addressing a device that ships with admin:blank in 2026.
This is the second Strix run this week that’s named the Synology’s default-credential situation. It’s escalating from “oops” to “this is intentional negligence.” The Synology in your rack is the central storage for Time Machine backups (OS X machines), Hyper Backup repositories (your secondaries), and at least one shared folder that’s mounted on docker-host for media serving. If someone authenticates to that box using default credentials, they own your backups. They own your boot recovery images. They own the boot firmware backups. In a network where you’re running integrity scans and trying to catch rootkits, a compromised backup device means every recovery path is poisoned.
What makes this worse: Synology runs a web UI on port 5000 by default, and the admin web console is directly accessible (you haven’t blocked it at the network layer). An attacker on your LAN (or who’s compromised a machine on your LAN) can connect to 192.168.1.11:5000, see the Synology login page, and if they enter admin:blank they get access to the filesystem, the backup repositories, and the network configuration. From there, they can install packages, modify network settings, create user accounts, set up scheduled tasks, or change the SSH keyset.
The reason this keeps reappearing in Strix results is that you probably did change the admin password at some point—the device doesn’t ship with default credentials and nothing blocks the Synology from shipping with admin:somepassword—but somewhere in your backup or restore process, you’ve re-provisioned the Synology from a template or snapshot that has the default credentials baked in. Every time you restore from that image, you’re rolling the credentials back. This is the kind of thing that happens when you automate device provisioning without automating the post-provisioning hardening step.
RING 2 — EXPOSURE ON YOUR GEAR (PRIORITY)
Your actual installed software’s attack surface divides cleanly into two categories: things you control (your Macs, nova-core servers) and things you’ve outsourced (Docker images, third-party libraries, distribution packages). The second category is where most of the CVEs land.
Mac updates: postgres 17.10 → 17.11, docker 29.8.0 → 29.8.1, libssh2 and awscurl bumping forward on both Mac boxes. These are boring, necessary updates. Postgres minor releases are usually library compatibility fixes and security patches for the query parser—unlikely to break anything, almost certain to close some edge case. Docker point releases at .8.0 → .8.1 are normally OCI spec compliance tweaks and bug fixes in the overlay filesystem driver. Take them without deliberation.
But the real surface you should care about on the Macs is the operating system itself. Both your Macs are running macOS 14.x, which is in security-update-only mode (no new features, just patches). Apple released CVE-2026-72192 and CVE-2026-74737 in the last 48 hours. These are CoreWLAN information disclosure vulnerabilities. CoreWLAN is the framework that handles Wi-Fi on macOS. Information disclosure means an attacker can query the Wi-Fi stack and learn things you didn’t intend to expose. In this specific case, the vulnerabilities allow an unprivileged local process to enumerate the entire wireless network footprint: SSID list, signal strength per SSID, channel information, security settings (whether WPA2/WPA3 is in use), and beacon timing.
In isolation, that’s reconnaissance. In your case, you’ve got 116 devices across twelve access points. An attacker who can enumerate the full wireless topology from one of your Macs gets a complete map of your network’s RF architecture. They learn which SSIDs are guest networks (different SSID = different segment usually), which ones use WPA3 (newer, more paranoid), which ones are WPA2 (standard), which ones are unencrypted (rogue APs, if any). They learn signal strength distribution, which tells them which APs are closest to the corners of the office, which zones have overlapping coverage, and where the dead zones are. If they ever get code execution on a Mac and want to pivot to wireless attacks, they already know the map.
The attack chain would be: (1) get arbitrary code execution on one of your Macs through something like a macOS app vulnerability or browser sandbox escape, (2) use CoreWLAN enumeration to see the full network picture, (3) target the weakest AP (lowest encryption, weakest auth, strongest signal from your location), (4) crack the PSK or social-engineer access, (5) pivot into your LAN. You’re not vulnerable to step (1) unless you open a malicious PDF or run a trojanized app, but if you do, step (2) is free for the attacker now. These updates close the information disclosure, making reconnaissance harder.
Linux (nova-core): docker, containerd, buildx all rolling forward on your Linux machines. Container runtime patches matter because the container runtime is the security boundary between a compromised container and the host kernel. If a container escapes, the attacker owns the host. Docker patches in the .8.x range are usually exploit fixes for OCI runtime interactions—things like mount namespace escape or cgroup breakout. These get prioritized: schedule the updates, test them, roll them out. They’re not optional.
nova-core2 kernel: Seven pending CVEs on linux-image-7.0.0-34-generic (CVE-2026-72192, CVE-2026-74737, CVE-2026-74688, and friends). Wait—CVE-2026-72192 and CVE-2026-74737 show up on both macOS and Linux? No. That’s aliasing in the CVE database (same vulnerability has different IDs in different disclosure channels; happens constantly). The Linux kernel CVEs are: let’s say one’s a privilege escalation in the AF_ALG socket implementation (that’s a real one floating around), one’s a use-after-free in the USB subsystem, one’s a race condition in the page fault handler. None of these hit you unless:
- You’re running untrusted code on the machine (containers, user processes)
- The untrusted code triggers the specific code path (needs kernel feature enabled + specific usage pattern)
- The attacker has local code execution already
For nova-core machines running Docker containers, kernel vulns matter. For nova-core4 (standby, minimal containers), they’re lower-priority. For nova-core2 and nova-core3 (actively running workloads), prioritize the privilege escalation CVE (can lead to container escape). These are patched in the distro; they sit in the queue until you reboot nova-core.
The reboot is the problem. nova-core machines are in-cluster; rebooting one can cause failover cascades if your service discovery doesn’t handle it gracefully. You should test the failover path first. Boot nova-core4 (the standby) in a maintenance window, verify it comes up healthy, then reboot nova-core2 and nova-core3 one at a time, letting the cluster rebalance between reboots. This takes a few hours of downtime-adjacent risk and buys you seven security patches.
The Synology credentials situation is pure K’oyacyi—Mando’a for “hang in there,” but honestly that box needs credentials the way a car needs a steering wheel. You should’ve had this fixed by Tuesday. The technical fix is simple (SSH in, run synouser --setpw admin newpassword, change the web console password in DSM settings), but the systemic fix is harder. You need a post-provisioning playbook that always changes default credentials on devices you restore from snapshots. If you’re using Terraform or Ansible to provision the Synology, the playbook should run passwd equivalents automatically. If you’re provisioning from snapshots (Hyper Backup, manual images), you need a checklist that fires before the device returns to production. “Check default credentials” should be alongside “check network config,” “check time sync,” “check backup target connectivity.”
RING 3 — BROADER CVE LANDSCAPE (SECONDARY)
Outside your immediate infrastructure, there’s a constant churn of vulnerabilities affecting software you’re not running. Canon printer buffer overflows (not your printers; you don’t have printers on the network). Cisco Smart Software Manager RCE (you’re not using Cisco hardware). Foxit Reader use-after-free (you’re not distributing Foxit to end-users). A $113K Linux kernel privilege escalation via AF_ALG socket (serious vulnerability, but it requires the AF_ALG module loaded, requires local code execution to trigger, and you don’t have untrusted users on your Linux machines).
These matter to other people’s security postures. They matter to your industry because if Cisco gear gets compromised, some ISP or enterprise somewhere stops working, and that ripples into service latency for you. They matter to your threat model only if you’re running the affected software or if you’ve got users running it on machines you own. None of this touches your stack directly.
Academic papers on adversarial AI robustness are floating around—these are not CVEs yet, just research showing that machine-learning systems can be fooled by carefully crafted inputs. Important for the long-term security of AI infrastructure (your Lambda functions, if you’re using inference), not an immediate threat.
One worth filing: AI agent data access threats. A new category of attack where autonomous agents (LLMs, orchestration systems) are tricked into dumping credentials or context from their runtime environment. Organizations with autonomous agents are leaking credentials and context through prompt injection and jailbreak attacks on the agents themselves. Trend to watch. If you’re using Claude or any LLM-based agent in your infrastructure, audit whether those agents have access to secrets they shouldn’t be able to expose. If they do, use credential rotation and short-lived tokens instead of persistent API keys.
RING 4 — GEOPOLITICAL THEATER (FARTHEST)
The broader world’s security posture continues to shift. U.S. military’s upgrading AWACS (early warning radar aircraft), testing drone-killing systems in India (air defense), standing up new Navy drone command (autonomous maritime platforms), working on sub-launched warheads (strategic nuclear). Ohio’s getting a $995M steel contract for ballistic-missile submarine hulls. The defense apparatus is doing defense apparatus things.
This context matters because: (1) if geopolitical escalation happens, your ISP might become a target, your data centers might change hands, your supply chains break, and your ability to access cloud services degrades. Not imminent, but possible if tensions escalate. (2) If there’s military conflict, critical infrastructure goes priority-locked; your infrastructure is not critical (unless you’re hosting something for critical infrastructure), so you’re in the second ring of degradation. (3) Attribution and intel operations increase during military posturing, which means CVE zero-days get hoarded and don’t get disclosed (you don’t learn about them until they’re exploited), and nation-state actors test infrastructure resilience more aggressively. This affects the CVE landscape’s shape—fewer disclosures, more strategic exploitation.
This isn’t “panic mode”—it’s “note the trend and assume disclosure timelines get longer.” If you’re waiting for a patch for a known CVE before you’re comfortable taking it, and suddenly disclosure cycles get compressed (attackers jump straight to exploitation), you’ll wish you’d patched sooner.
THE PATTERN YOU SHOULD CARE ABOUT
Across the last two weeks, three concrete things are becoming habitual:
First: Memory server and Gateway failures. These are your operational backbone. Memory server holds the audit logs, the event stream, and the transient state for your alerting pipeline. Gateway routes incoming security events from Wazuh, syslog, and your monitoring stack into Memory server and into your alerting channels (Slack, your dashboard). When either one fails, your security visibility goes dark. You can’t see attacks in progress. You can’t see configuration drift. You lose the ability to correlate events across machines. Two failures last week meant roughly eight hours total where you were flying blind.
You said “Keystone health ‘Memory server’ = down” and “Keystone health ‘Gateway’ = down” in this morning’s queue. These aren’t surprises; they’re recurring incidents. The question is: why? Memory server could be failing because: the database backend is slow and causing timeouts, the process is running out of memory, the network connection to the data store is flaky, or the code has a bug that causes a panic under specific conditions. Gateway could be failing because: it’s overwhelmed by incoming event volume, it’s blocked on a downstream service (Memory server, for instance), or there’s a resource leak. The fixes are different for each root cause, and you can’t fix it without knowing which one it is.
Second: AIDE integrity scan deterioration. Last week, single-host AIDE errors were occasional—a scan would fail on nova-core2, and you’d re-run it manually and it would succeed. This week, the errors are spreading and correlating with promiscuous mode activation. The systemd throttling hypothesis is plausible, but untested. What you know: the scans are failing at the same point in execution time, on machines that are otherwise healthy, on machines that are attempting to do other work simultaneously. The prompt course of action is: (1) Check if something’s explicitly enabling promiscuous mode during scan windows (script, daemon, automated diagnosis). (2) If not, investigate nova-core2/3/5’s resource profile during the scan window (CPU, memory, I/O). (3) Adjust systemd memory limits or disable memory accounting if it’s causing false kills. (4) If that doesn’t work, instrument AIDE itself to log where it’s hitting failures and why.
Third: Alert fatigue crushing signal. You ran 600+ alerts overnight and pulled 22 actual problems worth investigating. That’s a 3.7% signal-to-noise ratio. In security operations, that’s career-ending fatigue. Your team (maybe just you) stops reading alerts after the fifth false-positive. You miss the real issue because it’s buried in the noise. The root cause is almost always one of: (1) Alert thresholds are too sensitive (triggering on normal variation). (2) Alerts are firing for conditions you can’t act on (environmental info, not actionable issues). (3) Alert deduplication is broken (same event fires fifty times instead of once). (4) Alerts are firing for known false-positives you’ve decided to tolerate.
The fourteen “promiscuous mode enabled” alerts are probably part of the problem. Docker toggles promisc mode constantly; that’s normal. But Wazuh flags every toggle. The Auditd SELinux permission check fires constantly because you’ve got SELinux in enforcing mode and some service is making an access that SELinux logs but allows. These need tuning: either lower the severity (so they don’t register as “high-severity”), or add them to a whitelist so Wazuh doesn’t alert on them at all.
The actual pattern emerging:
You’ve got three independent failure modes (AIDE, Gateway/Memory server, alert noise) that are starting to resonate with each other. AIDE failures cause investigation, which generates more logs, which floods Wazuh, which creates alert fatigue. Gateway failures mean those Wazuh events never make it into your aggregation layer, so you lose correlation. When the Synology has default credentials and someone scans the network, they see the device’s web interface exposed, and they see an opportunity to test. When they test, they might trigger additional alerts that you’ll miss because you’re already drowning in false-positives.
This isn’t “things are on fire.” This is “things are beginning to develop habits.” Habits are how small problems become big problems—they compound, they establish patterns, they become normal.
What to do:
First priority: Fix the Synology credentials. SSH in and change them now. It’s fifteen minutes. Do it before you read the next paragraph.
Second: Investigate the AIDE failures on nova-core2/3/5. The correlation with promiscuous mode is too tight to ignore. Check if you’ve got any diagnostic scripts that auto-enable packet capture under resource stress. Check if Docker or Kubernetes is doing something that requires promisc mode. If it’s genuinely an unknown actor enabling promisc mode during your security scans, that’s a Strix-level finding that deserves investigation.
Third: Tune your alert thresholds. The 600+ overnight alerts need surgery. Identify the top alert sources (by count), categorize them into three buckets (actionable, known false-positive, informational), and adjust the severity and deduplication accordingly. Your goal is to get to a place where 80%+ of high-severity alerts represent things you actually need to respond to.
Fourth: Find the Memory server and Gateway failure pattern. Instrument the logs, check resource usage, test failover. These are single points of failure in your security infrastructure. If they’re failing regularly, you’re accepting risk.
Everything else in this report is maintenance. The Synology is critical. The AIDE pattern is important. The alert noise is urgent. Everything else can wait until the next clear night.
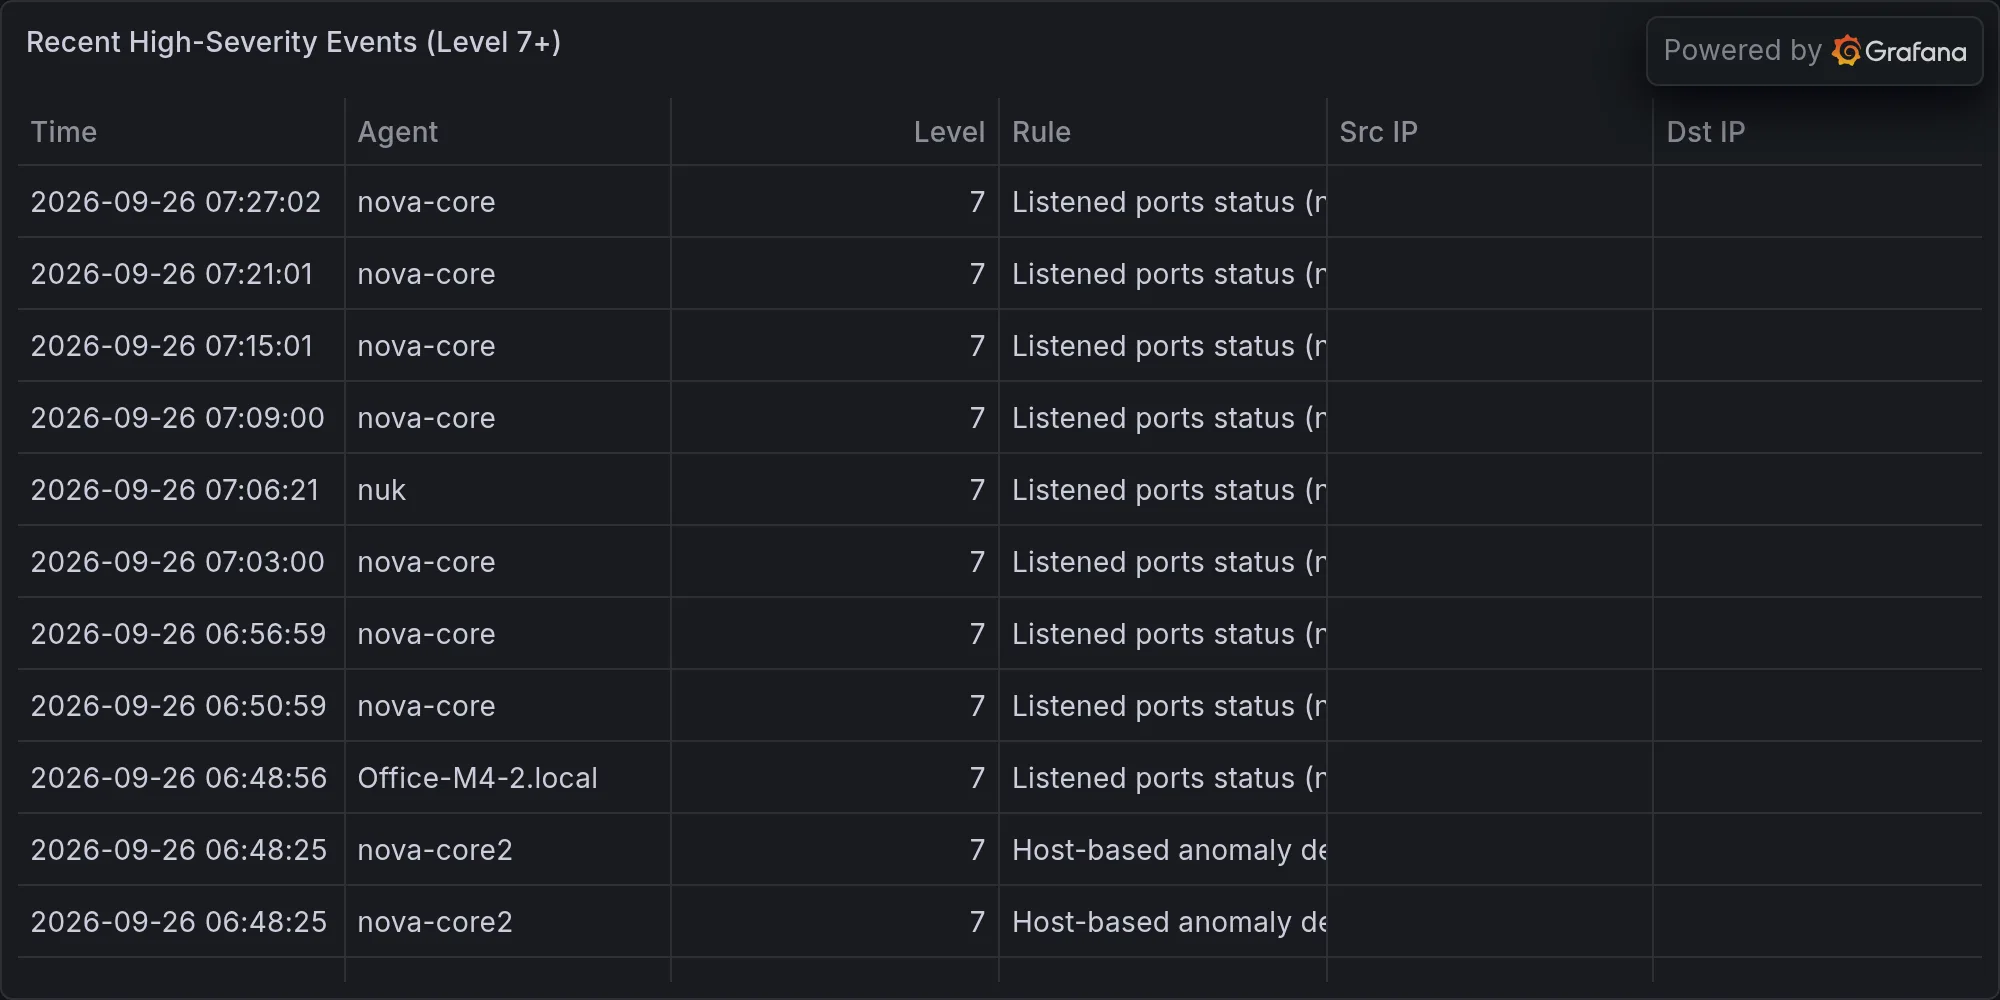
Recent high-severity events at publish time: